Performance Metrics
Execution speed measurement
CodSpeed instruments your benchmarks to measure the performance of your code. A benchmark will be run only once and the CPU behavior will be simulated. This ensures that the measurement is as accurate as possible, taking into account not only the instructions executed but also the cache and memory access patterns. The simulation gives us an equivalent of the CPU cycles that includes cache and memory access.
Once we have the number of cycles for a benchmark, we transform it into an execution time measurement by using the following formula, where
FREQUENCY is a constant set to the frequency (number of instructions executed per second) of a real CPU:
We then calculate the execution speed of the benchmark by taking the inverse of the execution time:
This is the displayed metric in the CodSpeed reports.
A performance increase of a benchmark will increase its execution speed. Same for a performance regression. However, if execution time was used, a performance increase of a benchmark would result in a decrease in its execution time. This would be counter-intuitive.
System Calls
System calls play a critical role in the performance of software, but they present unique challenges for accurate measurement. A system call is a request made by a program to the operating system's kernel, typically for I/O operations such as reading from or writing to files, communicating over a network, or interacting with hardware devices.
Due to their nature, system calls introduce variability in execution time. This variability is influenced by several factors, including system load, network latency, and disk I/O performance. As a result, the execution time of system calls can fluctuate significantly, making them the most inconsistent part of a program's execution time.
To ensure that our execution speed measurements are as stable and reliable as possible, CodSpeed does not include system calls in the measurement. Instead, we focus solely on the code executed within user space(the code you wrote), excluding any time spent in system calls. This approach allows us to provide a clear and consistent metric for the execution speed of your code, independent of your hardware and all variability that it can create.
Still, the wall time spent on system calls is recorded and this data is available in the profile view, providing insight into how much time is consumed by system interactions. While these times are not included in the overall execution speed metric, they offer valuable information for performance analysis.
In the future, we plan to enhance CodSpeed by emulating system calls. This will allow us to more accurately anticipate the performance impact of system calls, further improving the reliability and comprehensiveness of our performance measurements.
Performance Impact Metric
Baseline report to compare to
To create a performance impact, we need to compare the execution speed of the benchmarks against a baseline of those benchmarks' execution speed. Depending on the context of the run, the baseline report can be different.
Pull Request
When triggering a CodSpeed run on a pull request between a head branch and a base branch, the baseline report will be the report of the latest commit of the base branch with a CodSpeed run.
By default, when using the action/checkout in GitHub Actions, the checked-out commit of a pull request will
be the merge commit of the pull request. This means that GitHub will create a merge commit M between the base branch and the head branch, and use it as the checked-out commit.
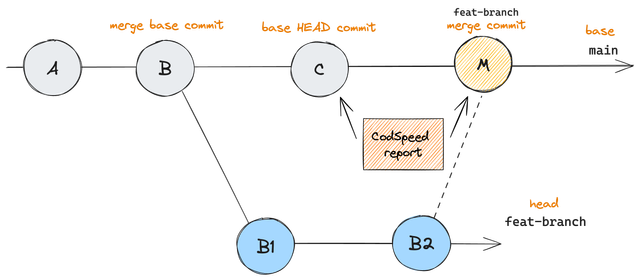
In this case, the report will be between the HEAD commit C of the base branch and the merge commit M. The report will thus only include the changes
of commits B1 and B2.
Every time a new commit is pushed on the feat-branch, the baseline report will be updated to the latest commit of the base branch with a CodSpeed run.
Branch
When triggering a CodSpeed run following a push on a branch, the baseline report will be the report of the closest commit of the branch.
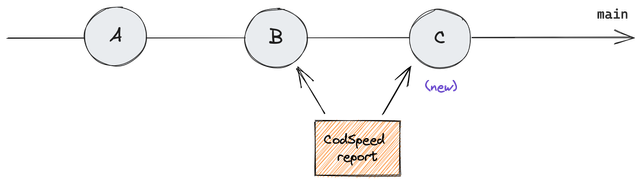
In this example, a report already exists for the commit B of the main branch. A new commit C is pushed on the main branch. The baseline report for C will be the report of the commit B.
Benchmark performance impact
The performance impact denotes an improvement or regression in performance of a benchmark. It is calculated by comparing the benchmark time measurement of the head commit with the time measurement of the base commit.
A negative performance metric means that the benchmark is slower than the previous commit. The closer its value is to -1, the slower it is.
A positive performance metric means that the benchmark is faster than the previous commit. Its value can go up to +Infinity to denote massive speed improvements.
Naturally, when the benchmark is as fast as the previous commit, the performance metric is 0.
Regression threshold
On the settings page of a project, you can set a threshold for a regression to be considered a regression. By default, this value is set to 10% (which is equivalent to 0.1).
The value can be set from 0% to 50% by an admin of the project.
Commit performance impact
To get the overall performance impact of a commit, we aggregate all the benchmark impacts. n being the number of benchmarks.
Regression threshold exceeded
If there is a regression above the threshold, the overall commit impact will be the biggest regression impact.
With impacts: [0.1, 0, -0.3] and a threshold of 0.25, the overall commit impact will be -0.3.
Improvement threshold exceeded
If there is an improvement above the threshold, the overall commit impact will be the maximum improvement impact.
With impacts: [0.1, 0.3, -0.2] and a threshold of 0.25, the overall commit impact will be 0.3.
No threshold exceeded
Finally, in the remaining cases, a geometric mean is calculated from all the benchmark performance impacts.
With impacts: [0.1, 0.3, -0.2] and a threshold of 0.5, the overall commit impact will be approximately 0.0459.
A geometric mean will give more relevant results than an arithmetic mean for this kind of measure as it will be less sensitive to outliers.
Performance impact Gauge
The performance impact gauge is a visual representation of the performance impact, displayed in multiple places of the CodSpeed UI.
Some examples of the gauge with their corresponding impact values:
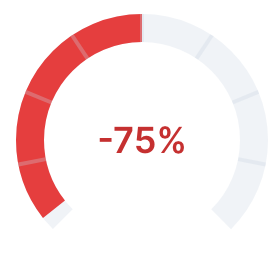
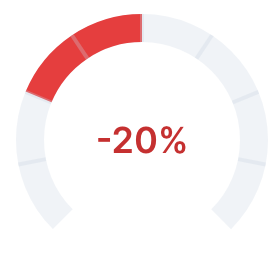
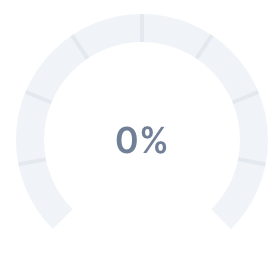
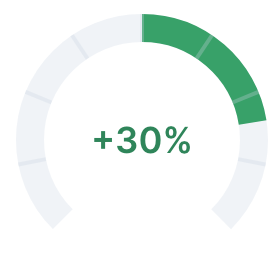
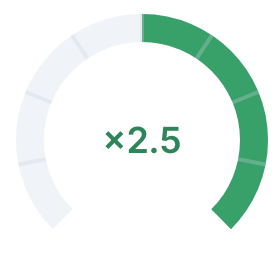
To make it easier to spot regressions and improvements, the mapping between the actual performance impact value and the gauge is not linear.