Trace generation
During the instrumented benchmark execution, we collect information about the execution of the called functions. This information is then used to generate a flame graph, bringing more granularity into the performance of your code.
Pre-requisites
- Node.js: Node 16 or higher, and the following minimum versions of the integrations
- Python: Python 3.12 or higher and
pytest-codspeed>=2.0.0 - Rust: Trace generation is enabled by default with any version of the integration library.
If you're using Foreign Function Interface, typically calling C/C++/Rust code from Python or Node.js, make sure to generate debug symbols for the foreign functions so that you can see them in the flame graph.
Reading Flame Graphs
Flame graphs are a visualization tool for profiling software. They provide a graphical representation of your program's execution, making it easier to understand the runtime complexities involved.
Let's start with an example:
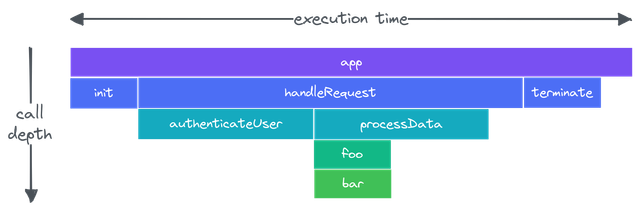
Here, each rectangle represents a function. The width of the rectangle is proportional to the amount of time spent in that function. The wider the rectangle, the more time was spent in that function. The vertical axis represents the call depth (a.k.a. stack depth), which represents the call hierarchy.
For this example, here is the call hierarchy:
- The root caller is the
appfunction. appcalls theinit,handleRequestandterminatefunctions.handleRequestcalls bothauthenticateUserandprocessData.processDatacallsfoowhich in turn callsbar.
The horizontal order of the blocks is not significant and does not represent the order of execution. The blocks are sorted alphabetically by function name.
Aggregated function calls
Functions calls are aggregated, so if a function is called multiple times, the time spent in all calls is aggregated into a single block.
Thus, the following code:
def bar():
    pass

def foo():
    bar()
    bar()

def main():
    foo()
    foo()
Will generate the following flame graph:
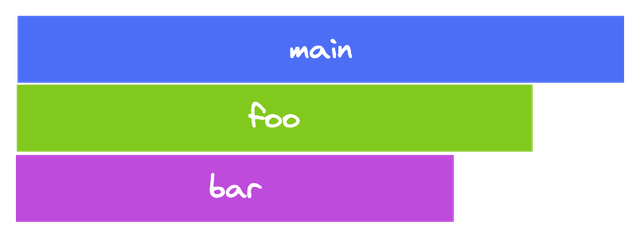
Where the foo function is called twice and the bar function is called 4 times,
but the time spent is aggregated into a single block for each function.
Self-costs
In the previous example, we could see the global cost of each function call quite clearly. However, it can be tricky to find out how much time was spent within the function itself.
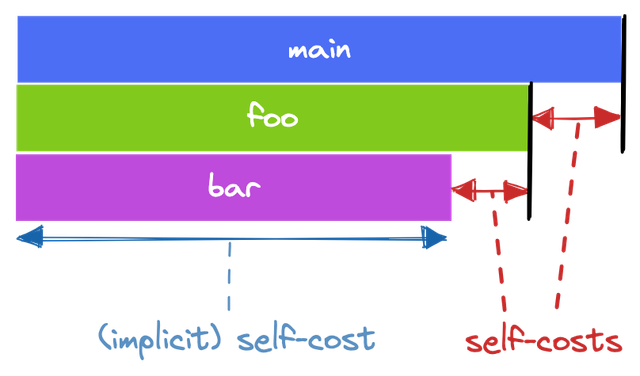
In the above illustration, we can see two types of self-costs:
- (implicit) self-costs: the time spent in the function itself is the whole width of the rectangle since it doesn't call any other functions.
- self-costs: the self-cost here is visible as the space not occupied by the children of the block.
In Python or Node.js, the self-cost is the time spent in the function itself, but also the time spent by the interpreter. This means that a function will always have a self-cost, even if the function does nothing.
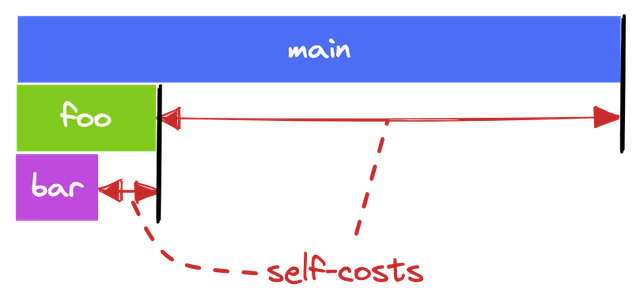
If we change a bit the example, adding a lot of computation directly in the main function:
def main():
    for i in range(100):
        # do some computation
    foo()
    foo()
Then the flame graph would look like this, with the self-cost of main being much bigger than before:
Viewing Flame Graphs
On the pull request page, you can access the flame graphs of a benchmark by expanding it.
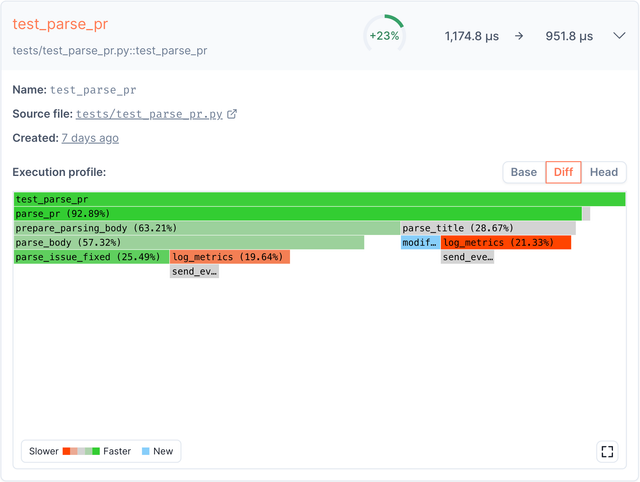
Three types of flame graphs are available:
- Base: flame graph of the benchmark base run
- Head: flame graph of the benchmark run from the latest commit of the pull request
- Diff: difference between the head and the base flame graphs